Finding an Indicator's Optimal Threshold
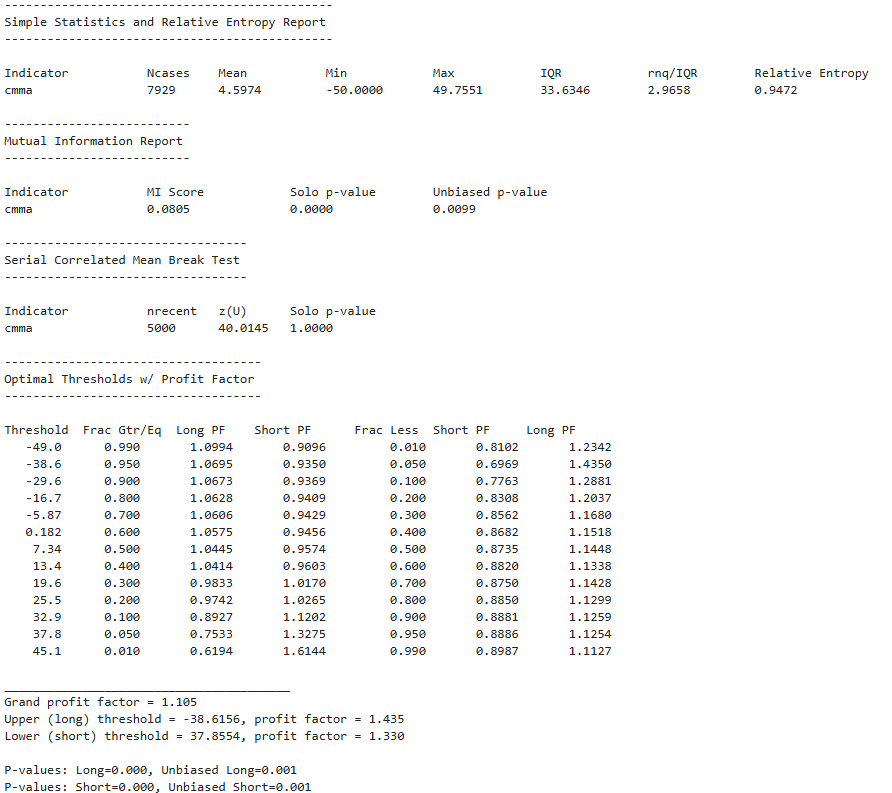
We use Python to generate a table of threshold values and find optimal indicator threshold values based on profit factor.
Wouldn't it be nice to know where the most predictive power lies in your indicators?
What about a table that shows the long and short profit factors associated with trades above and below certain threshold values so you can look for correlations?
Thanks to people who are much smarter than me, this is possible and not too difficult to accomplish in Python.
In this post, I take the idea presented by Timothy Masters in his book "Statistically Sound Indicators for Financial Market Prediction" and attempt to implement the concepts in Python. I use parallelization and Numba's JIT Compiler to speed up the process. The results of the test are printed to the terminal.
Threshold Optimization
I am not talking about indicator parameter optimization. I am talking about determining the optimal indicator values for long and short positions. For example, if you have an indicator (and we do) that ranges from -50 to 50, would it be more profitable to go long when the value is negative or positive? Does the predictive power lie in the tails or in the middle of the range? Does it even have any predictive power? Answering these questions can help us determine how to use an indicator in a trade system or if we even want to.
The fitness measure I use to determine the optimal threshold is profit factor. Profit factor is one of my favorite (and the favorite of many) fitness measures. It is the gross profits divided by the gross losses (profit/risk). Dead simple but super reliable if used correctly. I am also a fan of the Sharpe ratio, but it can be inconsistent and isn't the best choice for optimizing indicator thresholds. For this reason, I am only using the profit factor as a fitness measure for indicator threshold optimization.
It is also important to note how I am calculating this profit factor for threshold optimization. The profits/losses are calculated separately for each bar of data. In this case, that would be the daily bar. Calculating the return of each bar and then summing them to determine the profit factor helps give us a more honest answer when determining how well an indicator has performed at certain thresholds.
I am also using log returns to calculate this profit factor and shifting their values in the array by one bar to the left. The log returns are calculated from close to close, so we are measuring a "trade" from the close of the current bar (the bar where the indicator value is known) to the close of the next bar. After the log returns for an instrument are calculated, they are shifted to the left by one so the "future" return value is associated with the knowledge of the indicator value.
Screenshot:
This is just an example of the results of running the test. Other test results are shown too. I am currently just printing results to the terminal, a feature that I will keep in the functionality. However, I am currently working on creating a function that will run the entire indicator suite functionality and print all results to a markdown (.md) file, along with graphs and visualizations.
The rest of this post is for paid subscribers. Paid subscribers will have access to the private GitHub where all the Hunt Gather Trade code and strategies live. It is continuously being worked on and will expand as we explore the world of automated trade systems.


