Strategy 10 -- A simple and effective NDX mean reversion strategy
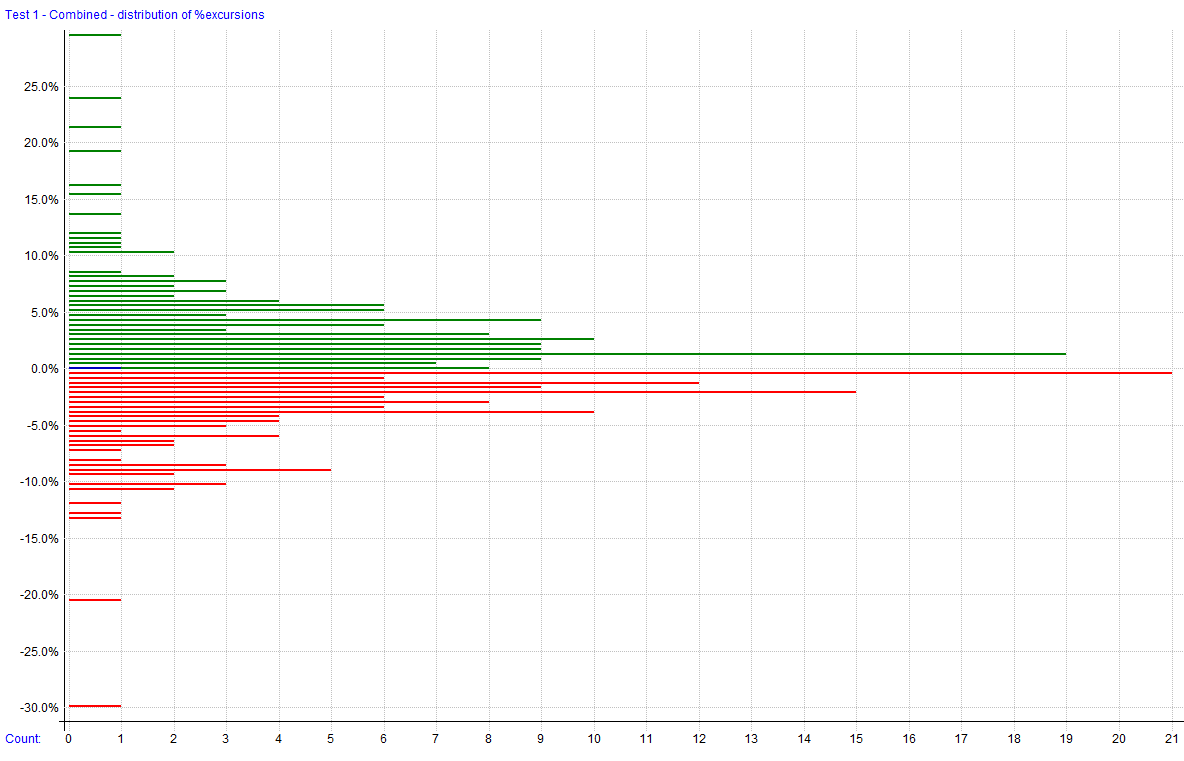
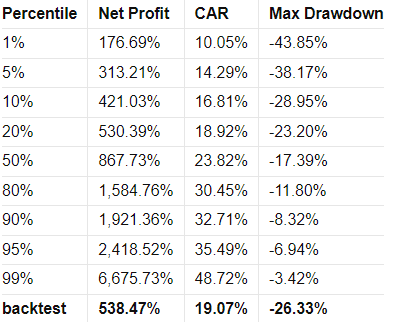
It started off as a remix but ended up being a brand-new strategy that made $538k with a PF of 2.85, Sharpe of 0.96, 63% accuracy, a CAR of 19%, and MaxDD of -26.3% over the last 10 years.
Disclaimer: the following post is an organized representation of my research and project notes. It doesn’t represent any type of advice, financial or otherwise. Its purpose is to be informative and educational. Backtest results are based on historical data, not real-time data. There is no guarantee that these hypothetical results will continue in the future. Day trading is extremely risky, and I do not suggest running any of these strategies live.
It might be a couple of days late, but Strategy 10 was worth the wait. This strategy started off as a touch-up of Strategy 6, but along the way it turned into a strategy of its own, no longer resembling or sharing any code with its predecessor. What we have now is a brand new, incredibly simple, NDX mean reversion strategy that uses the Linear Trend indicator we created not too long ago to time entries.
Strategy 10 has very few modifiable--read optimizable--variables. It uses no regime filter and instead just applies a very simple liquidity check to ensure the instrument is worth trading. Honestly, this strategy is so simple that it should not be difficult for someone to piece together how to reconstruct the logic from the information I have already given about it.
Let's jump right into it.
Strategy 10
NDX Mean Reversion Strategy
This is a simple mean reversion strategy that uses a boutique linear trend indicator for timing entries and a liquidity check to make sure that instrument is worth trading at the time.
Strategy Features:
Mean Reversion (long & short)
Trades stocks on the Nasdaq 100
Liquidity requirement
Uses no regime filter
Stocks ranked by trend strength when multiple instruments are available to trade.
Key Metrics: Key metrics are from the latest backtest date in the date range above in the test settings.
Compound Annual Return: 19.12%
Max Historical Drawdown: 26.3%
Average Holding Period: 25 Days
Expectancy Per Trade: 3.69%**
Win Rate: 63.31%
Profit Factor: 2.85
Sharpe Ratio: 0.96
MAR Ratio: 0.73
Data Source and Test Settings:
Data Source: Norgate
Universe: Nasdaq 100 Constituents (current & past for testing)
Benchmark: QQQ
Date Range: 01/02/2014 to 08/21/2024
Bar Size: Daily
Backtesting Platform/Engine: RealTest
Benchmark: This strategy is used to make a comparison to the results of the custom strategy.
Benchmark Strategy: Buy and hold QQQ.
Entry Setup: Enter QQQ.
Exit Rule: Reinvest dividends.
Strategy Results
Summary Stats
Combined Monthly Percent Gains
Correlations
Graphs
Trade Plots
Monte Carlo Analysis
Strategy Details
The rest of this post is for paid subscribers. Paid subscribers will have access to the private GitHub where all the Hunt Gather Trade code and strategies live. It is continuously being worked on and will expand as we explore the world of automated trade systems.


