The Price Change Oscillator -- A volatility indicator
There isn't much information on this indicator on the web and Chat GPT-4 was stumped too. Can this uncommon indicator help us quantify volatility?
Disclaimer: the following post is an organized representation of my research and project notes. It doesn’t represent any type of advice, financial or otherwise. Its purpose is to be informative and educational. Backtest results are based on historical data, not real-time data. There is no guarantee that these hypothetical results will continue in the future. Day trading is extremely risky, and I do not suggest running any of these strategies live.
I've written briefly about volatility before. This time, I'm testing and adding a volatility indicator to our pyquanttools (pqt) library. While the Average True Range (ATR) is a fantastic tool for normalizing indicators against changing volatility, it doesn't do much by itself. The Price Change Oscillator (PCO) is an indicator that scales (with some compression) and normalizes (with the ATR) the difference between two absolute volatility windows to provide an oscillating indicator.
This indicator, along with its logic and concepts for scripting, is taken from Timothy Masters' "Statistically Sound Indicators for Financial Market Prediction" (reference 1). Oddly enough, it looks like this book may actually be the only place that this indicator exists. A quick search online shows results for the Price Rate of Change (similar-ish) indicator and the Percentage Price Oscillator (related more to the MACD). Even Chat GPT-4 wasn't able to produce anything other than, "it's a specialized indicator." My copy of "Technical Analysis of the Financial Markets" only has two paragraphs about measuring the rate of change, which leads me to believe that it's very possible that this indicator isn't commonly used or documented anywhere outside of reference 1.
I want to take a moment on point out how I am attempting to construct posts like this. I am purposefully leaving the plain text (or Latex) explanations of this indicator available for free subscribers to read through. I am going to try and do this with everything except the strategy posts. The idea is that I am giving you enough information to recreate this indicator (or concept) on your own if you want. A paid subscription will get you access to the HGT GitHub repo, where all code from all posts resides and the always changing pqt library lives. So, if you want to see how I code it, and have access to the updates on the code, you can become a paid subscriber. If not, you can still recreate the logic for the indicators or tools on your own, in your favorite flavor of coding language.
The Price Change Oscillator (PCO)
The Price Change Oscillator (PCO) is designed to measure the difference between a short-term and a long-term moving average of log prices, normalized by a custom denominator. [1] The denominator accounts for the variability introduced by the lookback period and the Average True Range (ATR).
To compute the PCO, we first calculate the short and long moving averages of the log of closing prices. The difference between these two moving averages is then normalized by a denominator that includes the ATR and a factor based on the lookback period. Finally, the normalized value is compressed and rescaled using a Cumulative Distribution Function (CDF).
Formula:
Where:
PCO: is the final value of the Price Change Oscillator.
CDF: is the Cumulative Distribution Function, used to scale the normalized PCO value.
C: Compression factor, set to 4.0 by default. Can be adjusted for more or less compression.
log(close): Natural logarithm of the closing prices.
MA(log(close), period): Moving average of the log of closing prices over the short lookback period.
MA(log(close), long_lookback): Moving average of the log of closing prices over the long lookback period.
long_lookback: Long lookback period, calculated as ( \text{period} \times \text{mult} ).
ATR(2 \times long_lookback): Average True Range over twice the long lookback period, used for normalization.
log(0.5 x mult)/1.609: Factor derived from the multiplier for further normalization.
The choice of a CDF factor of 4.0 is based on empirical observations and ensures that the resulting PCO values are appropriately scaled. The CDF compresses the raw values to fit within a range, making it easier to interpret the indicator. By defaulting to 4.0, the PCO values are scaled to a range that is typically meaningful for most trading strategies, providing a balanced sensitivity to price changes.[1]
Indicator Soundness Report PCO
The generated report provides a comprehensive analysis of trading indicators, offering insights into their statistical properties, predictive power, mean stability over time, and optimal thresholds for profitability. It combines detailed statistical summaries, mutual information scores, mean break tests, and profit factor evaluations.
Simple Statistics and Relative Entropy Report
The Simple Statistics Table summarizes key metrics for each trading indicator, including the number of cases, mean, minimum, maximum, interquartile range (IQR), range/IQR ratio, and relative entropy. In the table, a lower range/IQR ratio suggests a tighter, more predictable dataset, while an optimal relative entropy indicates a balance of diversity and uniqueness without excessive noise.
Ncases: Number of cases (bars) in feature (indicator).
Mean: Average value of the feature across all cases.
Min/Max: The minimum and maximum value of the feature across all cases.
IQR: Interquartile Range, measures range minus the top and bottom 25% of the raw range.
Range/IQR: A unitless measure of data dispersion relative to its middle 50%.
Relative Entropy: Measures the difference between two probability distributions; a value of zero indicates identical distributions.
Mutual Information Report
High MI scores indicate a strong relationship between the indicator and the target variable, suggesting potential predictive power. Low p-values further validate the indicator's statistical significance.
MI Score: Measures the mutual dependence between the feature and the target.
Solo p-value: Initial significance estimate, proportion of permuted MI scores equal to or higher than the original MI scores.
Unbiased p-value: Adjusted solo p-value considering the number of permutations plus one, reducing bias.
Serial Correlated Mean Break Test Report
The Serial Correlated Mean Break Test Report identifies potential breaks in the mean of each trading indicator, taking into account serial correlation. This test helps detect significant shifts in the mean over time, indicating nonstationary behavior in the data.
nrecent: The number of recent observations considered in the test.
z(U): The greatest break encountered in the mean across the user-specified range.
Solo p-value: Measures the significance of the greatest break while accounting for the entire range of boundaries searched. If this value is not small, it suggests that the indicator does not have a significant mean break.
Unbiased p-value: Adjusted solo p-value considering the number of permutations plus one, reducing bias.
These results make me wonder if my MCMBT needs some attention.
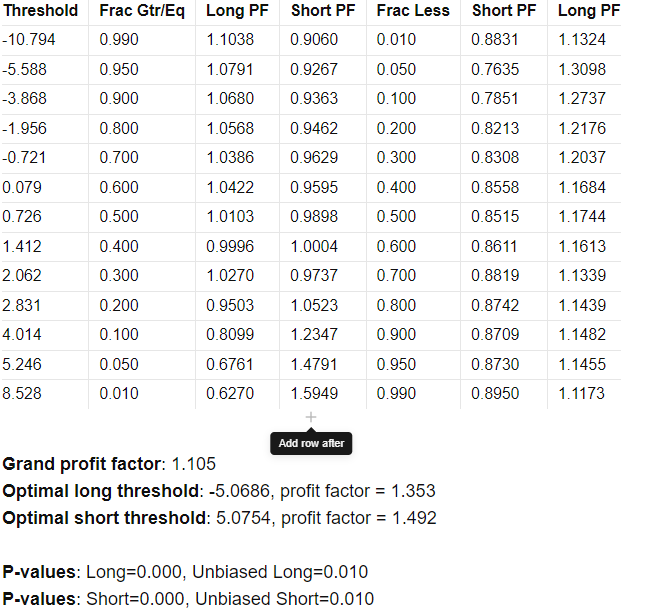
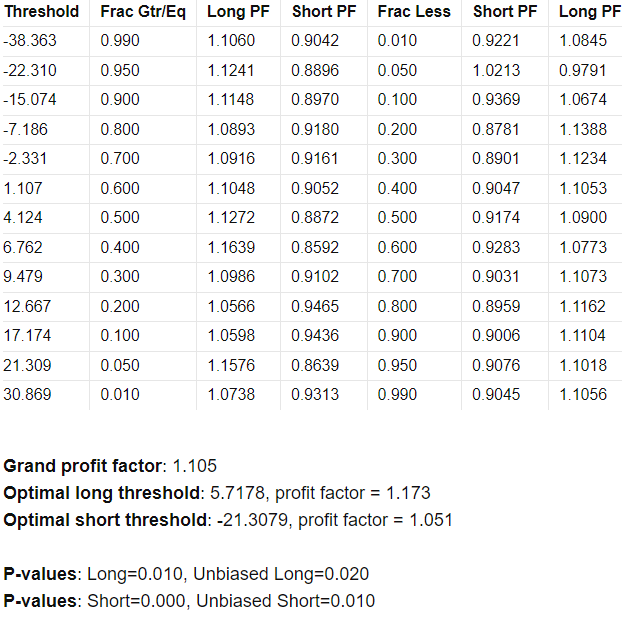
Optimal Thresholds w/ Profit Factor Report
The Optimal Thresholds w/ Profit Factor Report evaluates various threshold levels for trading indicators to identify the most profitable long and short positions. The report includes the fraction of data points greater than or equal to the threshold, the corresponding profit factor for long and short positions, and the fraction of data points less than the threshold with their respective profit factors. The optimal thresholds at the bottom indicate the threshold levels with the highest profit factors for long and short positions, while the p-values provide statistical significance for these thresholds.
pco_2
pco_5
pco_10
pco_15
pco_20
The rest of this post is for paid subscribers. Paid subscribers will have access to the private GitHub where all the Hunt Gather Trade code and strategies live. It is continuously being worked on and will expand as we explore the world of automated trade systems.


