On Strategy Optimization
This post discusses different backtesting and optimization techniques for trading systems. At the end, we will discuss a backtesting protocol that I will be experimenting with for the HGT community.

On Optimizing Trade Strategies

Update:
This article was originally published for paid subscribers but has since then been set free. It has been some time since I have visited this article or used NinjaScript/NinjaTrader. Reach out if you have any questions.
This article grew into a much longer post than intended. My original intention was to briefly discuss key concepts to consider when creating a backtesting and optimization protocol. Then I started researching and found out this subject isn’t that cut-and-dry.
I will use the terms optimization and backtesting interchangeably throughout the post for ease. Consider them synonymous.
Like everything else in trading, it isn’t easy to zero in on solid answers without access to academic journals or knowledge of how successful quant funds are operating. I don’t like referencing papers I haven’t read through myself, and since I don’t have any journal access anymore, I won’t be referencing many studies. Some books carry good information. I have recently read Dr. Eric P. Chan’s Quantitative Trading, and some of what I discuss will come from that book.
We will discuss some basic concepts needed to understand how backtesting works and introduce you to several methods for verifying backtest data. There will be a small part on data considerations, but this section needs its own post. At the end of the post, we will discuss some common pitfalls and biases traders should be aware of when testing trade systems. Finally, for our paid subscribers, we will discuss the backtesting protocol HGT is looking to implement moving forward.
Disclaimer: the following post is an organized representation of my research and project notes. It doesn’t represent any type of advice, financial or otherwise. Its purpose is to be informative and educational. Backtest results are based on historical data, not real-time data. There is no guarantee that these hypothetical results will continue in the future. Day trading is extremely risky and I do not suggest running any of theses strategies live.
Brute-Force or Algorithmic Parameter Optimization?
There are two ways to go about optimizing your trade strategy. The exhaustive (brute-force) method and the algorithmic method. Each one has its merits. I want to touch on each method briefly and then discuss some considerations before determining which method to choose for your testing purposes.
The exhaustive method will systematically generate and test all possible parameter combinations without attempting to optimize the process. This method is thorough, straightforward, and objective. It can also be time-consuming and resource-intensive (CPU, RAM). The more parameters there are for optimization, the less scalable the exhaustive approach becomes.
Multiple algorithmic methods can be used to test a trading strategy. They include genetic algorithms, Monte Carlo Simulations, machine learning (ML) algorithms, and probably many more. These methods all have the same purpose: to optimize the optimization process. How meta.
For parameter optimization, genetic algorithms can provide a means for testing large sets of data without having to try every combination available. It does this by iterating through select portions and mutations of the parameters. It uses a selection model that simulates natural evolution through “generations” of data to zero in on optimal solutions.
Which method to choose should be based on the strategy and how many parameters it has. The capabilities of your computer will also come into play. Got access to a state-of-the-art server with a billion cores and more RAM than any one person knows what to do with? If not, playing around with a genetic optimizer for strategies with lots of optimization parameters might be a good idea.
Celan, author of ATS, does a good job explaining how Genetic Optimizers work and discusses their use for optimizations in the following article.

Fitness Functions, Coefficients
A fitness function is a crucial component in the context of backtesting a trading strategy, especially when using genetic optimizers. It measures the performance of a trading strategy according to specific criteria, such as net profit, max drawdown, Sharpe ratio, and so on. Its purpose is to guide the optimization process and select the strategies that perform better according to the fitness function.
When using a genetic optimizer, the fitness function directly influences the outcome of the optimization process. Strategies that perform better according to the fitness function are more likely to be selected for reproduction in the next generation. This helps steer the strategies towards optimal performance over successive iterations.
The following are a few examples of fitness functions that I use to backtest and optimize trading strategies.
Profit Factor is net profit / net loss. That means that for the result to improve, net profit has to increase, and net loss has to decrease. However, it doesn’t take max drawdown into consideration.
Number of Equity Highs measures the peaks/highs in the period tested. The highs should be consistent across the period of testing. This can yield some wild results that have a “high number of equity highs” but then shit the bed for over half the time frame in question.
The TS (TradeStation) Index is a cool little coefficient for optimizing trade strategies. TradeStation describes this function as a "fitness function that maximizes the Net Profit and Winners while minimizing intra-day drawdown. It calculates the Net Profit * NumWinTrades / AbsValue (Max. Intraday Drawdown)."1
Dr. Ernest P. Chan, known for using advanced algorithms and statistics for trading strategy development, argues in his book Quantitative Trading that the Sharpe ratio, maximum drawdown, and MAR (Managed Account Reports) ratio are the most important for easy comparisons across strategies and traders.2 Understanding the different ratios and fitness methods will help us develop our backtesting protocol as we proceed.
The following link is a tutorial I made for creating the Trade Station Index Fitness Function for NinjaTrader 8.

How much Data Should be Used for Backtesting?
There is much debate on this topic. One thing that everyone does seem to agree on is that you want to make sure you have enough data to protect against over-fitting. The point of debate appears to be what classifies as “enough”. Let’s examine another concept from Quantitative Trading to illustrate one way to determine what backtest length to use.
Previously I mentioned the three ratios that interested Dr. Chan. He later explains, in regards to the Sharpe ratio, that there is a minimum amount of data needed to insure that your ratio is accurate (Chan, E.).
If you want to be statistically confident (at the 95 percent level) that your true Sharpe ratio is equal to or greater than 0, you need a backtest Sharpe ratio of 1 and a sample size of 681 data points (e.g., 2.71 years of daily data).
The higher the backtest Sharpe ratio, the smaller the sample size is needed. If your backtest Sharpe ratio is 2 or more, then you need only 174 data points (0.69 years of daily data) to be confident that your true Sharpe ratio is equal to or greater than 0.
If you want to be confident that your true Sharpe ratio is equal to or greater than 1, then you need a backtest Sharpe ratio of at least 1.5 and a sample size of 2,739 (10.87 years of daily data).
If we consider this ratio to be true with smaller time periods, and you deem the Sharpe ratio to be important, this could be a good guideline to stick too until new information presents itself. Obviously, the amount of time needed for the backtest will be dictated by the time period that the strategy is being ran on and the Sharpe ratio result of the test.
Personally, I use that criteria as an interesting guideline. I consider it when looking at backtest results, but that’s about it. I believe that the amount of data needed for a backtest is relative to the strategy and to the instrument. In my manual trading and as an intra-day trader, I base my decisions for entry (and SL/TP) on more recent price activity. I am not unique in this regard. Therefore, I think it would be wise to consider more recent price activity, say the last year, as more influential than older data.
Of course, using smaller data sets can lead to over-fitting or data-snooping bias, as Dr. Chan refers to it (Chan, E.). Luckily, there are other methods for backtesting we can incorporate to help minimize this.
Data Considerations
Another hot topic of debate. The general consensus is that you want good-quality historical data for backtesting. The better quality of the data, the more reliable the results. This does bring a question to mind, though. Is the data coming in live as reliably accurate as the backtest data? Would there not be a case to use the same data provider for historical testing and forward-testing regardless of quality or filtration?
While I am well aware that there are many different data providers, and they each have their merits, I can’t help but think about a similarly controversial weapons training concept. It could be a bad metaphor, but the idea is that you carry the same (or ballistically similar) ammunition you practice and train with. Many people will practice with more affordable ammo and then carry some top-shelf defense ammunition they have never/rarely shot. Even some government agencies are guilty of this, but they usually require you to at least pass a qualification with the ammunition intended for carry. Some people don’t believe it makes a difference, and some do. I am in the latter camp. I like my tools (and myself) to perform the same way every time.
Admittedly, I need to do more research on this area to provide a comprehensive explanation of what you need to consider when choosing data. This section could be a post all on its own, and it probably will be in the future. For now, my thoughts on this are simple. Use a reliable data source with minimal biases that adjusts the data for splits, dividends, etc. Recording the tick data from your live data provider and saving it as historical data may be beneficial. Build a database of historical data recorded live from the same data provider from which you intend to deploy your automated trade system.
In-Sample and Out-of-Sample Testing
The reason we backtest our trade strategies is to validate it against historical data and hope that its future performance is similar. In order to help make sure that our backtest performance is more accurate, we need to create as realistic a simulation as possible. There are a few techniques that can help with this. One such technique, and possibly the most important, is using in-sample and out-of-sample data for testing.
If you are a reader of Automated Trading Strategies you will know that Celan uses a 1 year time period for optimization and then runs the strategies on a simulated forward-test to check the validity of those results. This forward-test is an example of out-of-sample testing and is possibly the single most important part to testing a trade system (Chan, E.). Especially if the out-of-sample data is live, as it is in a forward-test or with paper trading.
Another way to mimic unseen market data is by separating your historical data into two parts, a training set and a testing set. The more recent data should be the testing set. When you build your strategy, you optimize it against the training set and then test those results on the test set. The image below attempts to illustrate this concept.

Validation
Validation is a 2-step process. First, you verify that your parameters/signals are stable. This can be done a couple of ways. Then, you use varying backtest techniques to test the strategy and see if holds up across tests. It is unlikely that a signal will actually “pass” all of the tests. The purpose of the testing is to try and get a realistic feel for how the strategy might perform live.
Signal Stability
There are two parts to this section. Period validation and multi-market validation. Multi-market validation may not apply to certain strategies designed to capitalize on something specific to a particular instrument. Backtesting protocols should be fluid and can change to fit the needs of a particular strategy. The goal is to ensure that the parameters are stable and not over-fit.
Time Period Validation
The first, and simplest, test to perform is a time period validation test. This is where you optimize your strategy against different time periods and search for the best results. The trick here is to make sure that you return enough results so that you can see them side-by-side. Charts work great for this.
Consider a scenario in which you use the EMA as a signal for trade entry. You would optimize the strategy around the EMA and then test it between multiple time periods. For example, you could test it from the 1-minute- to 100-minute charts to see the best results. Let’s assume that you use net profit as your optimization fitness. Hypothetically, the net profit results for the 50EMA could turn out to have the best results; however, the results for the periods beside it (48, 49, 51, 52) could be negative. If the time period with the best performance is an outlier, then the signal is probably unstable.
The system must be stable, too, meaning it trades continuously and consecutively without change. It shouldn’t have clashing signals or logic outside of its nature. Simple is better here. Having a framework for development and templates can help mitigate these logic conflicts.
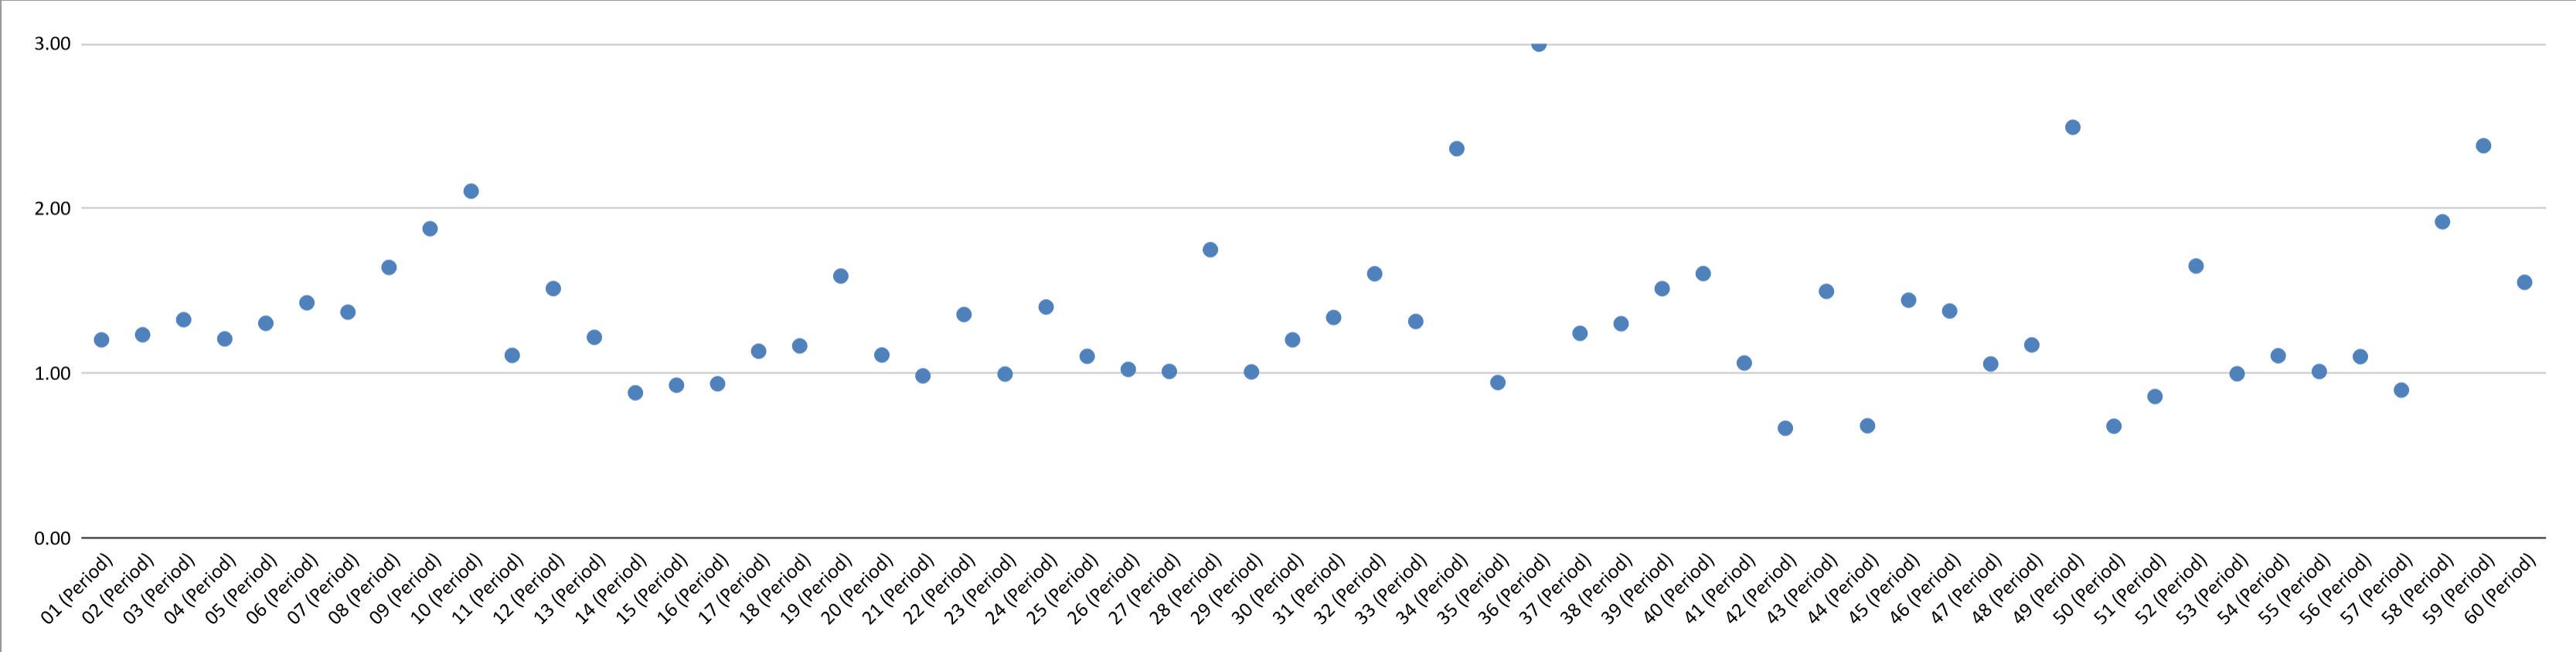
The following is an example of optimization results (fit to profit factor) for periods 1-60. You can see that there are some outliers (and possibly some underlying pattern) but the results are all relatively consistent.
Multi-Market Validation
Markets are different, and not every strategy works in every market. Unless you are designing a strategy that works specifically on one instrument, a good goal would be to have multi-market validation with a strategy. This can be done by optimizing a strategy on the instrument it is intended for, then taking the optimized parameters from that test and using it in multiple time-frames across other instruments.
You aren’t looking for it to have excellent performance on the other instruments, but you do want it to work on some level across them all. On the first test, you want to test different instruments within the same time frame as the optimized test. You are looking for pass or fail. After the testing is done and you have the results, calculate the average pass rate of the instruments to determine how well they performed. Then, optimize the time frame for each instrument and log the results.
To simplify, it is a 3-step process.
Optimize the strategy parameters and time frame on one instrument.
Test different instruments (in different markets) with the same parameters and time frame as the initial optimization. Log results.
Optimize the time frames for each different instrument. Log results.
After the last test, you can perform parameter optimizations across each instrument and time frame. This can be done as extra validation for the strategy or if you are looking to deploy the strategy across instruments and time frames.
Detailed Testing
This is where everything else happens, where you can customize and debate techniques until the sun goes down. BLUF: the two best tests for trading strategies are paper trading (simulated with live data) and live trading. If you want to try and mimic unknown market activity, the following two techniques can help.
Walk-Forward Analysis
Walk-forward analysis (WFA) is similar to using in-sample/out-of-sample comparisons for testing, but instead of doing it once, it slices the whole period of data into multiple, layered in-sample/out-of-sample comparisons. Behold another beautiful hand-drawn example:

There is another way to do this where the in-sample size gets bigger: keeping the data it started with and adding increments with the out-of-sample data. If using a built-in feature for this type of analysis, you will want to see which variation is being used. I am not sure if there is a benefit of one over the other or specific use cases where one would be more appropriate than the other.
WFA attempts to mimic how you would trade live, but there is no randomness to the test. It is still done with historical data and is prone to error. Since real-time market conditions are dynamic and unpredictable, this still can’t beat a simulated forward test. If you are going to use WFA in your backtesting protocol, it would be wise to use the same periods for your samples throughout the entire process. For example, use 3 months for the testing set and 1 year for the training set when conducting the WFA. This way, when you re-evaluate your live (paper or otherwise) strategy every quarter, you have previous data to compare to from the WFA.
A quick search on Google Scholar showed more than a few results of researchers using walk-forward validation techniques to test results of many different types of time-varied data, including research and data specific to trading.
Monte Carlo Simulations
Monte Carlo simulations add a layer of statistical analysis to backtesting results. It randomly shuffles trade results, providing a range of potential outcomes rather than a single, static result. The results will retain the same profit factor (or whatever fitness) but will instead generate varying scenarios regarding drawdown and other performance metrics. The value of this test lies in the ability to simulate a wide range of market conditions and the potential impact on the strategy.
Some Monte Carlo simulations may exclude certain trades or repeat others in the simulation, leading to different equity curves. This feature helps in assessing the robustness of a strategy under varied conditions. Platforms like NinjaTrader 8 and Wealth Lab, among others, use variations of this method. Both variations help understand the range of outcomes one might expect during live trading.
Note, most Monte Carlo simulators will use a mathematical formula to create the “randomness” used in the shuffle (pseudo-randomness). This is technically not the same as “pure” randomness, which can be achieved using something like Features - RANDOM.ORG, an API that uses atmospheric noise to generate random data. This might be a consideration in a commercial application.
Question, is there a Monte Carlo simulation that runs the randomness on the out-of-sample data before testing results? In other words, it randomizes the financial data itself and thus actually changes when and what types of trades are placed (as the underlying signals would now be different). Since there are technically infinite possibilities, I assume some type of genetic algorithm would need to be used. Would this even be a Monte Carlo Simulation anymore?
Biases, Over-fitting, and Common Pitfalls
This section could go on forever if I let it. In the interest of brevity, I will list a few rules to help you avoid most pitfalls associated with trade strategy optimization.
Justify the amount of data you use for testing.
Use good/reliable data.
Make all strategy logic look backward.
Limit the amount of optimizable parameters.
The purpose of justifying the period you use is to avoid using an inappropriate amount of data for testing. It doesn’t mean that you will be correct or that there is even a correct answer, but it means that you will have to think about it. This process will help ensure you aren’t tailoring a strategy to a specific period of data.
The debate and conversation on data have yet to be finalized. This is specifically talking about historical data. There is still an argument for using the same data provider for your historical data and your live trading, but I don’t have anything to support this at the moment.
The third rule is specifically about avoiding look-ahead bias. Look-ahead bias is when you design a strategy that uses information it couldn’t have had when a trade was made (Chan, E.). In other words, it looks to the future for information it won’t have when running live.
The less there is to optimize, the less there is to over-fit. For parameters that can’t be removed, attempt to make them dynamically defined. A good example would be creating a dynamic stop loss/take profit order, such as using ATR (average true range) instead of static variables. The leveled-up version would be to use ML to determine the values.
Proposed Backtesting/Optimization Protocol
It probably isn’t challenging to figure out what I will say here. When I first started researching information for this article, I was under the impression that I would drastically change the way I approach testing trade systems. I will be the first to admit that how I look at problems tends to lead to an oversimplification of the issue. This is because I subscribe wholeheartedly to the 80/20 Principle.3 Oddly enough, my standard to keep things simple still seems to apply here.
I plan to use in-sample/out-of-sample testing techniques for my backtesting protocol. I currently use a single 1 year period for backtesting and optimization. This will change to 15 months, the last three months being the testing set. I will still compare these results to a standard 1 year backtest for the time being.
Parameter validation will be another particular point of interest. In NT8, you can create instrument lists that make testing multiple instruments easier. It will streamline the process of validating the signal stability. I suggest making several lists that will help you, but to start with, I would create a list of instruments across various markets that you believe would be good litmus tests for their respective markets. I will use 9 different instruments in this list. Nine, for no particular reason other than it squares easily.
Optimizable parameters can get you in trouble and lead to over-fitting. Aside from validating the parameters, I will also look for ways to dynamically assign values inside strategies. This will help to lower the risk of over-fitting our strategies.
I currently use NinjaTrader Market Data for my streaming and historical data. I am interested in checking out different historical data providers. I know strategies will perform differently live, depending on their data provider (missed trades, slippage, etc). I am curious if there are significant differences in historical testing.
I like the idea of using WFA and Monte Carlo simulations for further strategy testing. However, since neither of them beat a live forward test, I wonder if there is much need to implement them as a standard in a backtesting protocol. If you intend to go straight to live trading strategy after testing without running a simulated forward test, I could see them being more helpful.
The ultimate out-of-sample testing, and the closest you can get to the real thing, is a simulated forward test. This will be my focus during this first quarter of 2024. I intend to set this up in my own home server lab. However, I still need the equipment to make this possible. I am planning this with a sysadmin to ensure I set it up properly and have a secure network. I will document the process and post an article for anyone looking to set up a home lab instead of using a VPS service.
In summation:
Implement in-sample/out-of-sample testing in the optimization phase of strategy development.
Validate stable parameters across time and markets.
Dynamically assign values where applicable and feasible in the strategy logic.
Run live, simulated forward tests (paper trading) on strategies.
Look for the next strategy post to drop around the middle of January. This strategy will come from the ATS Twilight Strategies, strategies that didn’t trade in the forward test. Spoiler alert: We learned how to get it to work. Then, I will introduce a few different ways to handle SL/TP orders. I will also introduce a new way to look at strategy development with NinjaScript that will change our strategy template and how we program our strategies.
These changes will mean some upcoming changes in the GitHub as well. These updates and processes will smooth themselves out as we continue moving forward. For now, I ask that you stay on the path and be patient with me. I have many ideas I want to experiment with here, but I have to do some learning and growing along the way.
Happy hunting, happy foraging, happy trading, and happy new year.
Feel free to comment below or e-mail me if you need help with anything, wish to criticize, or have thoughts on improvements. Paid subscribers can access this code and more at the private HGT GitHub repo. As always, this newsletter represents refined versions of my research notes. That means these notes are plastic. There could be mistakes or better ways to accomplish what I am trying to do. Nothing is perfect, and I always look for ways to improve my techniques.
Chan, E. P. (2009). Quantitative Trading: How to Build Your Own Algorithmic Trading Business. John Wiley & Sons.
Ferriss, T. (2007). The 4-hour work week: Escape 9-5, live anywhere, and join the new rich. Crown Publishing Group.
This is a rough topic, but I enjoyed reading this and look forward to the next.