Strategy 11 - Mean reversion, featuring the Stochastic indicator
Simple and efficient mean reversion strategy in two flavors. Both beat the QQQ buy and hold with no optimization.
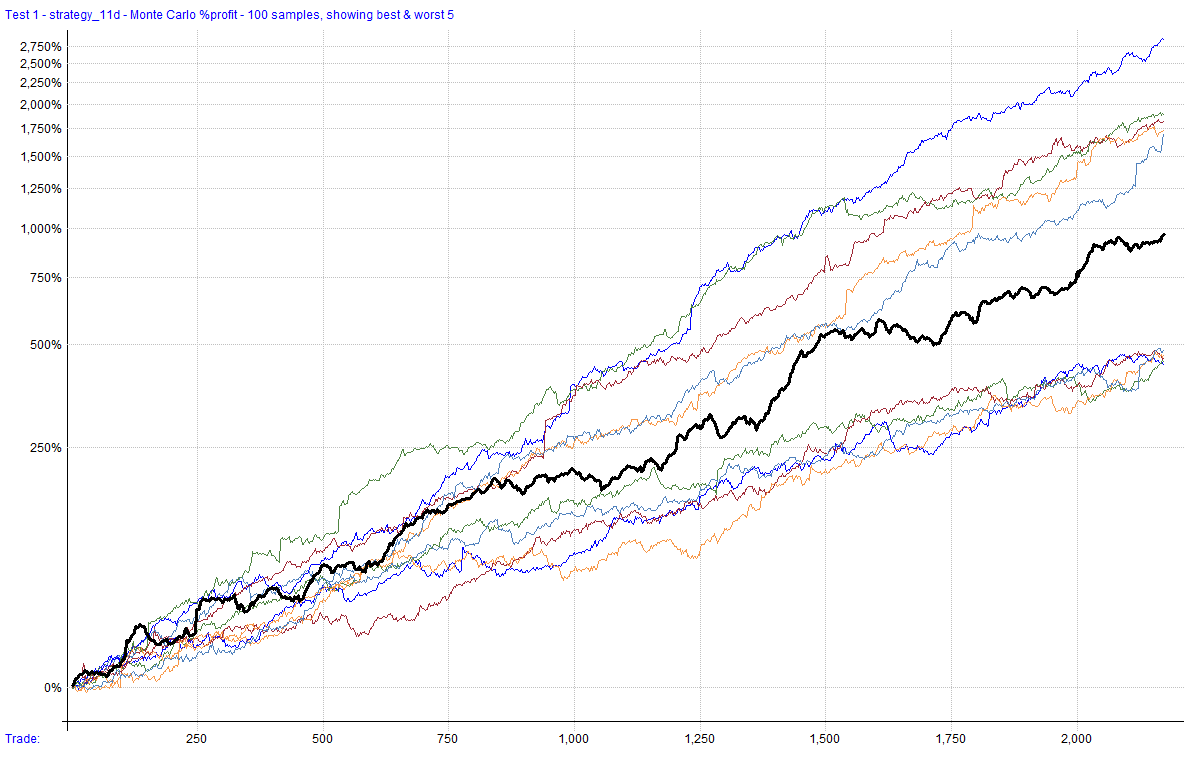
Now that I have a subdomain to house reports, Strategy posts are going to get brief. I will list the summary stats of the strategy and provide links to the reports that have graphs etc. Then, I will jump into strategy logic and coding it for RealTest.
This strategy has two variations. One is a more traditional method of entering and exiting trades, the other is a dynamic sizing with routine rebalancing (like Strategy 9). Each has their advantages and might suit different traders/portfolios.
Summary Stats
11:
Compound Annual Return: 22.60%
Max Historical Drawdown: -27.12%
Average Holding Period: 7.29 Days
Expectancy Per Trade: 1.06%
Win Rate: 71.20%
Profit Factor: 1.58
Sharpe Ratio: 0.97
MAR Ratio: 0.83
11D:
Compound Annual Return: 24.15%
Max Historical Drawdown: -14.70%
Average Holding Period: 6.43 Days
Expectancy Per Trade: 0.08%
Win Rate: 57.73%
Profit Factor: 1.60
Sharpe Ratio: 1.32
MAR Ratio: 1.64
Reports
Strategy 11 - The Logic
This strategy utilizes the stochastic indicator that was discussed here:
For this strategy, we use the twice-smoothed variation of the indicator with a 14-day lookback.


