Strategy 7 – A mean reversion futures strategy.
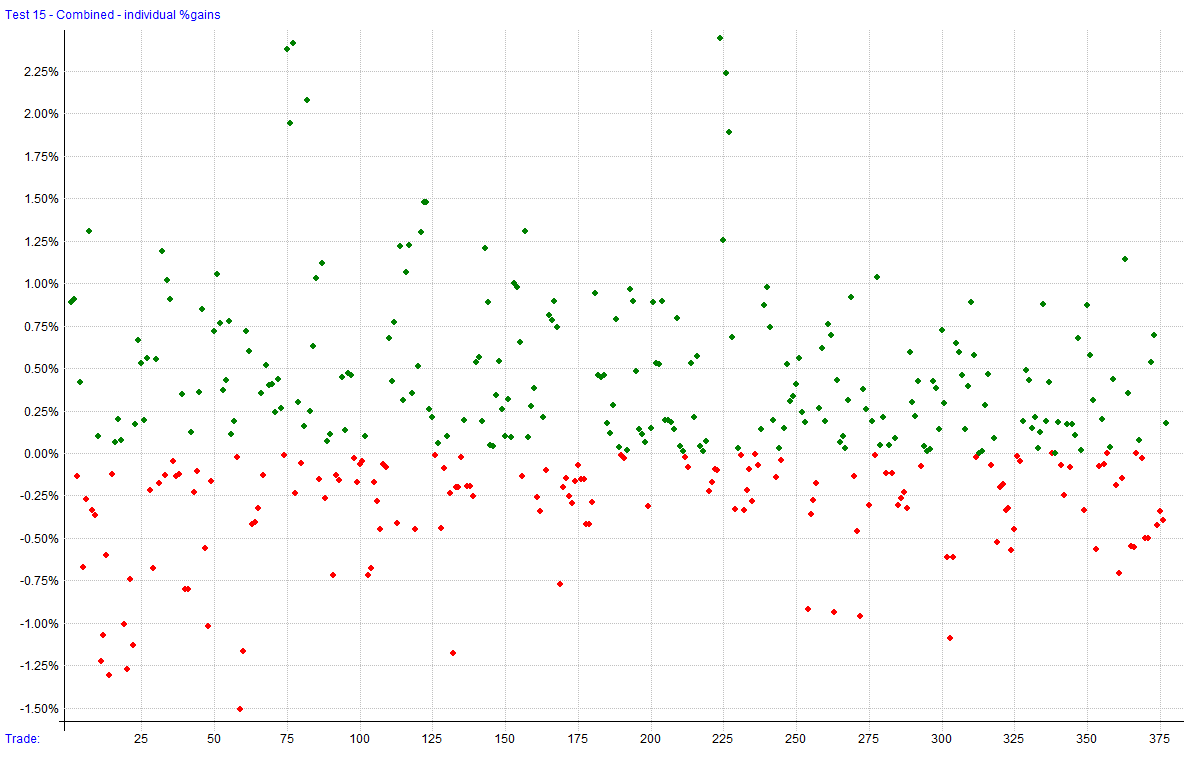
We have a equities futures strategy that trades micros. It made $66k since 2020 with 377 trades, PF of 2.13, Sharpe of 1.51, RoR of 12%, MaxDD of -8.5%, and has a 59% accuracy on trades.
Disclaimer: the following post is an organized representation of my research and project notes. It doesn’t represent any type of advice, financial or otherwise. Its purpose is to be informative and educational. Backtest results are based on historical data, not real-time data. There is no guarantee that these hypothetical results will continue in the future. Day trading is extremely risky, and I do not suggest running any of these strategies live.
I just got back from Mexico last week and it feels like the wife and I haven’t stopped since we got home. Our toddler made quite a few physical advancements in our month abroad, so now responsibility on the SAHD front has increased. This doesn’t mean anything for the HGT newsletter, just that I need to use my time more efficiently. It does, however, mean that some of my posts my be more subject oriented and with less free-writing.
I know, I know. The only reason you read this newsletter is because of my silly lessons from the past and the personality and experience (unrelated experience) that I bring to the field.
But really, this is just an excuse to make writing easier, isn’t it, Larry?
Probably. Fuck, I guess I can’t let difficulty stand in the way of bringing my readers what they really want. But, what do I do when I have more strategies than I do shareable stories from my past?
You’re telling me that after more than a decade in EMS, working everywhere from the streets of Atlanta to Baghdad, the farmlands of Georgia, and places like Pine Ridge, South Dakota, you’re going to run out of stories that have nothing to do with systematic and algorithmic trading?
That’s a good point. I could probably never run out of stories using just stories related to being a paramedic in Atlanta. Actually, since this strategy uses volatility throughout the logic to define trade criteria, entries, and quantity, I can probably talk about…
Lessons from the Past
When you work in a high-volume urban EMS environment, it doesn’t take long to learn about the volatility of call volumes. If you paid attention, it didn’t take much longer to realize there were ways to game that volatility and volume. For example, at Grady EMS, they used a system called “system status management.” In short, this data-driven method used historical call data to position ambulances in areas likely to have higher call volumes. Once you knew the rules of the system, you could learn how to take advantage of it.
Where ambulances were posted depended on how many were available at the time, which was directly linked to call volume and timing. If there were fewer than 5 or 6 available units, you couldn’t game the system because your post assignment would always be in high-volume areas of the city. Even if you managed to transport your patient to the northside, you were doomed to be assigned a post back toward the city center.
However, if the number of available units was above that threshold and call volume remained steady (i.e., not volatile), you could theoretically ride out a super slow shift on the northside of the city. This required transporting a patient to one of the northern hospitals (a tricky part for a large population in Atlanta) and a day with low volatility. This, of course, depended on the total number of ambulances available and call volatility. Once you recognized the day’s pattern, you could play games with the system.
Back to the Present
The four years I worked in Atlanta (Grady EMS followed by EMS in Dekalb County) made me intimately familiar with the effects of volume and volatility. Being able to discern the day’s pattern was vital if you wanted to plan a slower day or find somewhere safe from the never-ending carousel of calls around the main hospitals.
It’s easy to make the connection to trading here. It’s no secret that volume and volatility need to be considered when planning any type of trade. Some strategies perform better in high volume/volatility, while others do the opposite. It’s a matter of determining which is ideal for your current strategy.
Backtest Results
The long side of this strategy did not perform well in 2020. Outside of that, results for both sides of this strategy are somewhat similar and relatively consistent.
Start Date: 01-02-2020
End Date: 07-08-2024
Data Series: Daily
Universe: Equity futures contracts. ES/MES, NQ/MNQ, YM/MYM, RTY/M2K, and EMD
Strategy Stats
Combined Monthly Percent Gains
Equity
Drawdown
Daily Returns
Monthly Returns
Individual Gains
Monte Carlo — Equity
Monte Carlo — Drawdown
Distribution of Gains
Distribution of Excursions
Using this strategy to assist manual trading
Remember the disclaimer. This is just a note about my a trade I took. I only discuss them when I believe that they are applicable to a topic in a post. That makes the sampling you see here very biased. Trading is risky, trading futures even more so. Do not trade with money that you can’t afford to lose.
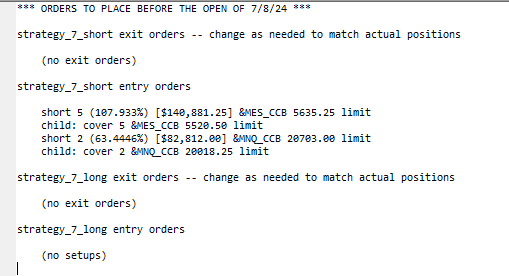
On 07/08/2024, I used the orders generated by this strategy to help plan a trade. The RealTest orders function is a feature of the software that generates the orders for the next day. The results show like this:
Since I primarily trade ES/MES, I decided to watch today’s price action to see what happens if the price hits the limit sell price at 5635. From the chart below, you can see that the price started climbing around 07:00 EST and didn’t stop until it broke through the recent high (an all-time high) and topped out around 5637, two points north of the limit order generated by the report above.
Since price had just broken through a big structure, and hadn’t returned to test that level, I decided to wait until price put in some type of reversal sign to make entry. This happened about 30 minutes after the open of US equities markets (0930EST). I waited for the bar to break the low of the previous bar and entered around 5633. Then, I set my profit target for the recent structure that we broke out of. This played out in two more bars, ending my quick trade for the day.
The purpose of this trade synopsis was to show how you can use a algorithmic trading strategy to help plan trades in your manual trading. Of course, this would mean that you should have a good, systematic manual trading system as well. Even with all that, some trades fail. That is the nature of the beast. For example, today (07/09/2024), I used the same method to plan a trade, but missed a key setup with my manual trading that ended up putting me short one level after the move I should have spotted. This ended with me covering the position for a loss.
Strategy 7
This strategy is designed to capture mean-reversion opportunities in futures markets by utilizing short-term RSI signals, adjusted for volatility and market regime conditions. It uses RSI(2) for trade entries, ATR(5) as a volatility measure, and a normalized MACD (12, 26, 9) as a market breadth/regime filter indicator. It is designed as an intraday strategy, entering trades intraday via limit orders and exiting at the close.
Logic
Inspiration for this strategy came from my own recent research into the Relative Strength Index and reading The Holy Grail still works - by Quantitativo. Portions of the strategy (such as entry quantity calculations) come from reading through documentation on RealTest.
The rest of this post is for paid subscribers. Paid subscribers will have access to the private GitHub where all the Hunt Gather Trade code and strategies live. It is continuously being worked on and will expand as we explore the world of automated trade systems.


