The Close Minus Moving Average Indicator
It's the CMMA. There is a little math, Python code, and how I currently implement this indicator in RealTest. Don't miss it.
Disclaimer: the following post is an organized representation of my research and project notes. It doesn’t represent any type of advice, financial or otherwise. Its purpose is to be informative and educational. Backtest results are based on historical data, not real-time data. There is no guarantee that these hypothetical results will continue in the future. Day trading is extremely risky, and I do not suggest running any of these strategies live.
Since the last post, I have updated the report functions in the pyquanttools (pqt) library. Each report is now formatted to print statements in a Markdown-friendly manner. I created a function that runs all tests and prints the results (for one or multiple indicators) to a Markdown or text file. This report also generates plots that show the indicators and target returns over time.
It feels like I am at a good stopping point (for now) with the indicator tests. I have plans to improve them (optimize them to run faster) in the future, but for now, I am going to turn my focus to learning how to import and manage data better locally for the tests. Further in the future, I intend to turn the library into a command line tool. I don't know how I am going to go about that yet. Optimizing the functions for speed comes first.
This post is going to go over the CMMA indicator and present how I implement the concepts for this indicator in Python and in the RealTest backtesting software. The concepts for this are all pulled from "Statistically Sound Indicators for Financial Market Prediction" by Timothy Masters. It is my attempt to recreate the concepts for this indicator from that book in Python, and subsequently RealTest.
Close Minus Moving Average
The raw logic for this indicator is simple. Take the current bar's logarithmic (log) close value and subtract the moving average of log closing prices from the previous bar. To make it more robust, the value is normalized by the average true range (ATR) of the close price. The ATR is multiplied by the square root of the lookback window plus one. This should help with the variability of the lookback length.
The indicator is then compressed and rescaled using a cumulative distribution function (CDF).
Formula:
Where:
CMMA: is final value of the Custom Moving Average indicator.
CDF: is the Cumulative Distribution Function, used to scale the normalized CMMA value.
C: Compression factor, set to 1.0 by default. Can be adjusted for more or less compression.
log(close): Natural logarithm of the closing prices.
MA(log(close), period)[1]: Moving average of the log of closing prices, lagged by one period.
ATR(252): Average True Range over a 252-period window, used for normalization.
sqrt(period + 1): Square root of the period plus one, used for scaling the ATR
An example given in reference 1 showed a 10-bar lookback window for the moving average normalized by a 252-day ATR for normalization. I did not want to hard code this into the indicator, in case it was being used on something other than daily bars. Therefore, I calculate the ATR period by using a multiplier. This is a simple fix, but can be adjusted however the trader likes. In the python code, it will have the option to change the multiplier variable or default to 5 if no argument is given. Masters suggests that the lookback period for the ATR be well over the lookback period for the moving average lookback to ensure the value is smooth.1
Visualizations and Test Results
The following screenshots are the results from the indicator tests discussed in previous posts. The test function in pqt also prints out plots of the indicators and the target returns. Tests were performed againts 20+ years of daily SPY data retrieved from Yfinance.
Simple Statistics and Relative Entropy Report
The Simple Statistics Table summarizes key metrics for each trading indicator, including the number of cases, mean, minimum, maximum, interquartile range (IQR), range/IQR ratio, and relative entropy. In the table, a lower range/IQR ratio suggests a tighter, more predictable dataset, while an optimal relative entropy indicates a balance of diversity and uniqueness without excessive noise.
Ncases: Number of cases (bars) in feature (indicator).
Mean: Average value of the feature across all cases.
Min/Max: The minimum and maximum value of the feature across all cases.
IQR: Interquartile Range, measures range minus the top and bottom 25% of the raw range.
Range/IQR: A unitless measure of data dispersion relative to its middle 50%.
Relative Entropy: Measures the difference between two probability distributions; a value of zero indicates identical distributions.
Mutual Information Report
High MI scores indicate a strong relationship between the indicator and the target variable, suggesting potential predictive power. Low p-values further validate the indicator's statistical significance.
MI Score: Measures the mutual dependence between the feature and the target.
Solo p-value: Initial significance estimate, proportion of permuted MI scores equal to or higher than the original MI scores.
Unbiased p-value: Adjusted solo p-value considering the number of permutations plus one, reducing bias.
Serial Correlated Mean Break Test Report
The Serial Correlated Mean Break Test Report identifies potential breaks in the mean of each trading indicator, taking into account serial correlation. This test helps detect significant shifts in the mean over time, indicating nonstationary behavior in the data.
nrecent: The number of recent observations considered in the test.
z(U): The greatest break encountered in the mean across the user-specified range.
Solo p-value: Measures the significance of the greatest break while accounting for the entire range of boundaries searched. If this value is not small, it suggests that the indicator does not have a significant mean break.
Unbiased p-value: Adjusted solo p-value considering the number of permutations plus one, reducing bias.
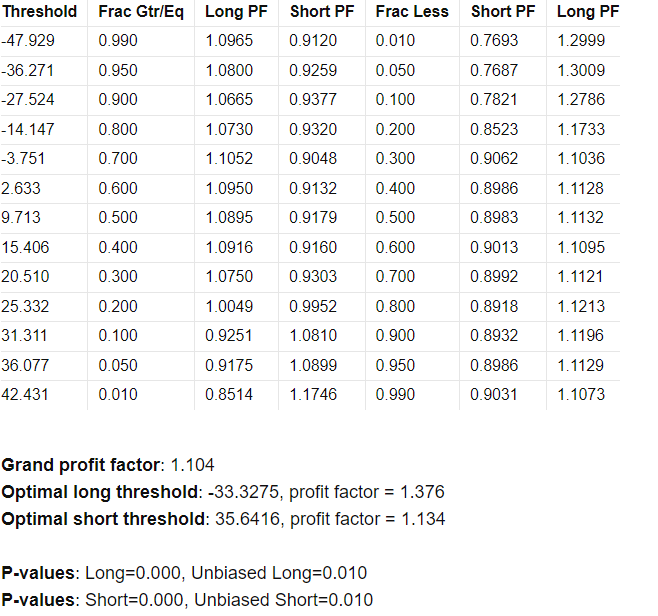
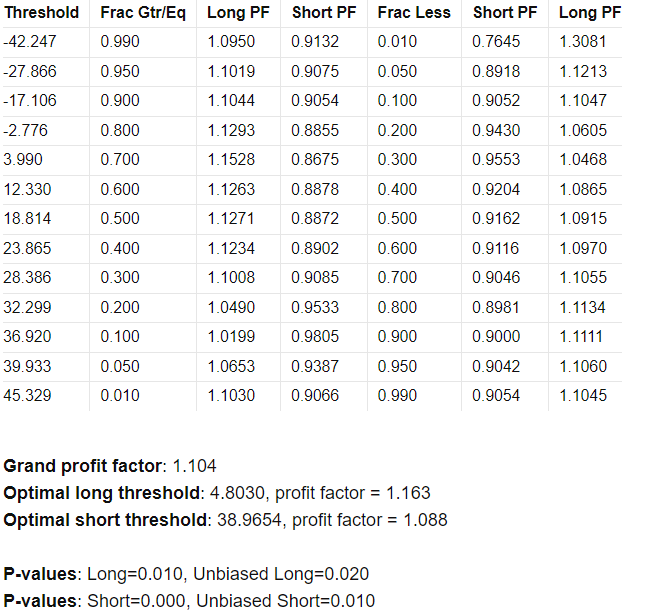
Optimal Thresholds w/ Profit Factor Report
The Optimal Thresholds w/ Profit Factor Report evaluates various threshold levels for trading indicators to identify the most profitable long and short positions. The report includes the fraction of data points greater than or equal to the threshold, the corresponding profit factor for long and short positions, and the fraction of data points less than the threshold with their respective profit factors. The optimal thresholds at the bottom indicate the threshold levels with the highest profit factors for long and short positions, while the p-values provide statistical significance for these thresholds.
cmma_10_25
cmma_20_10
cmma_50_5
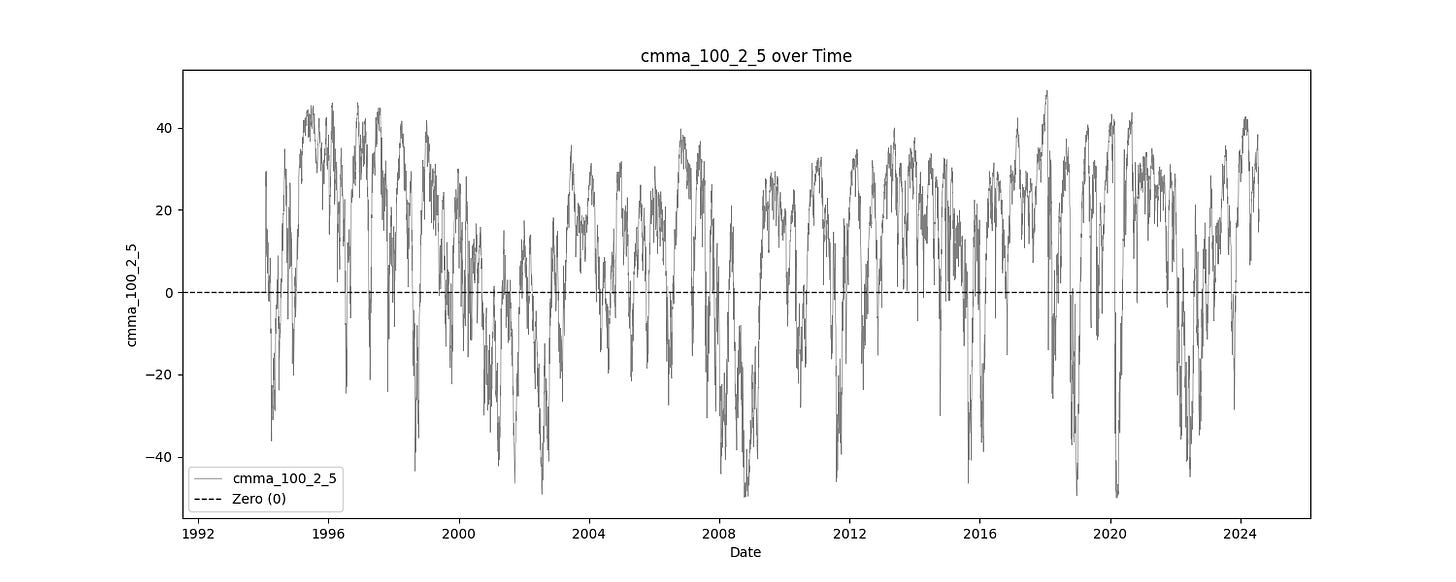
cmma_100_2_5
cmma_200_1_5
The rest of this post is for paid subscribers. Paid subscribers will have access to the private GitHub where all the Hunt Gather Trade code and strategies live. It is continuously being worked on and will expand as we explore the world of automated trade systems.


